

Prescribe then Diagnose?
Doctors don’t (or shouldn’t) prescribe drugs without seeing the patient, or without fully examining and then diagnosing the patient. Doing so would be not only dangerous, but likely will not help the patient heal. Doctors diagnose and then prescribe. Excellent doctors diagnose correctly and then prescribe correctly, so the patient improves quickly, with low risk, and with the best ‘cost-performance’ ratio.
As an example, many years ago, before getting married, foolishly I smoked a cigar at my bachelor party. Because I never smoked and wasn’t used to this, the smoke-induced inflammation resulted in an upper respiratory infection, that resulted in a lingering, dry cough. It impacted my work, home life, drained my energy and limited my focus. Also, it was painful, but I waited a few weeks hoping it would go away by itself – I desensitized to the issue and lived with the nagging, daily issue without realizing it.
Eventually, I gave in and saw a physician who didn’t properly diagnose me. After going through two or three courses of different antibiotics over a couple of additional weeks (which have side effects) and then switching doctors, we finally determined the source of and reason for the cough (diagnosis), and the proper drug was prescribed. The cough went away within days. Finally, a great outcome.
The doctor’s office called me to follow-up too, so they could confirm whether I was healed, or not. In business, this could be the time and cost-performance ratio using data to drive outcomes and a good result, with the right follow-up and support.
What if Your Company Was Not Properly Diagnosed?

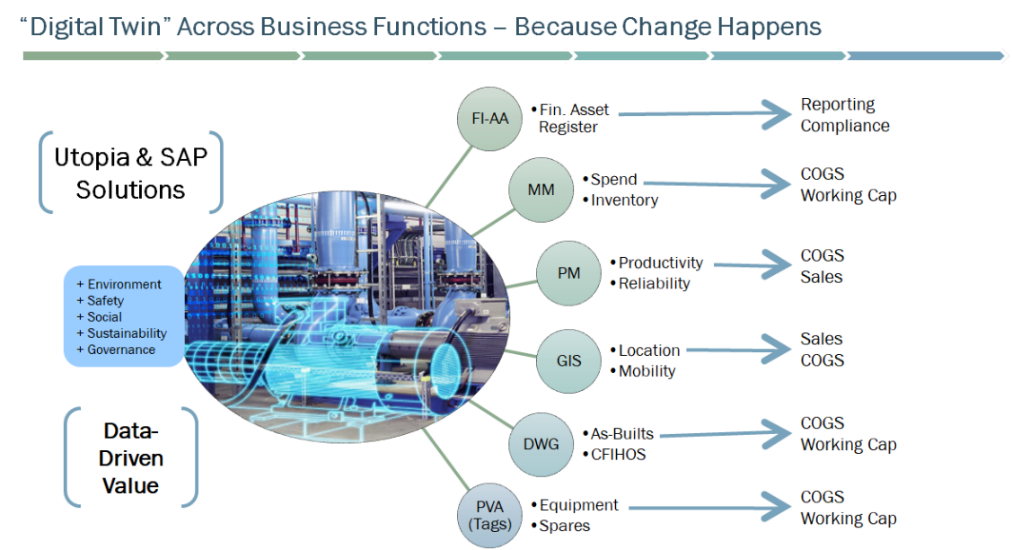
What would a company look like if it was a sick patient? In this diagram with the big A/C Motor, the concept shows an overlay of the digital engineering drawing vs. the installed equipment. If this A/C Motor, the power supply, the Pump, valves, fittings, belt, hoses, sensors, mounts, if any element in this assembly fails, it is possible that the subsequent lack of fluid movement would cause some other kind of failure in this plant. Maybe it is cooling fluid for a nuclear power generator? Maybe it’s the water supply for a city? We know the value of this system is to be on 24x7, year-round so that the consumers who get that power or receive that clean water have what they always need.
If any of the critical data such as the Financial Asset Register and related cost and accounting information, the Plant and Functional Location information, the Equipment specifications and configuration, the OEM recommended Spare Parts List, the “as-installed” parts list, the “as-built” engineering drawing, the inventory levels of critical spare parts in the storeroom in that plant for the equipment installed in that plant, the geo-location information for remote sites, the RFID or Barcode tags (for mobile assets), and the system of record (ERP system) are not all in agreement, then managing the system over time becomes more and more difficult.
Work orders become backlogged, maintenance becomes deferred, costs of parts and labor (in-house and/or contracted services) cannot be tracked, maintenance scheduling and planning mistakes happen, maintenance execution errors occur, time is wasted and worst of call, that onetime data driven error event may cause unplanned downtime, which might impact an important and large production run for one of your largest customers, or the machine may start a fire or explosion which might cause loss of other assets and loss of life and limb. It happens and it is expensive for many reasons.
The implications of bad data are safety hazards, environmental disasters, regulatory compliance mistakes, financial accounting errors, plant maintenance costs becoming excessive (wrench time, 1st time call resolution, equipment reliability and overall equipment effectiveness), inventories either bloated causing excessive costs and working capital constraints or too low resulting in stock-outs which could result in excess downtime and higher freight and expediting fees, inability to evaluate spend and reduce costs of procurement in the supply chain, supply base risk and disruption and inability to keep production levels meeting demand which could result in lost sales and reduced revenues.
Bear in mind, having streamlined supply chain operations, procurement, spend analytics and assuring alternative sources of raw materials and critical spare parts is important (especially now with COVID-19 supply risks), but the decisions of what to buy, the specification, the quantity, where it is required, when it is needed, and from whom is the approved, trusted source comes normally from production and plant maintenance; therefore, there must be a digital link connecting the information across functional areas to gain the highest levels of collaboration, synergy, cost-savings, and efficiency.
Because change happens too – it is important to have data standards, with rules, and organizational data governance operational models with workflows to enforce them, with the means of getting this data clean, keeping it clean, and keeping it synchronized across systems over time as equipment changes, production levels change, demand changes, supply changes, suppliers change, prices change, labor changes – nothing is constant. At some point plants are sold or bought, they are upgraded, they are increased in size, machines get replaced – nothing stays the same. Change happens. Getting a proper diagnosis sometimes is not easy.
How to Get a Proper Diagnosis
To that end, for about a decade our strategic partner SAP has surveyed and interviewed more than 10,000 customers across industries globally regarding estimating the likely value from SAP business solutions (including the Solution Extensions by Utopia). The SAP Value Engineering (VE) team, consisting of hundreds of individuals worldwide, engages clients in a variety of methods and leverages their Value Lifecycle Management (VLM) tool, developed by SAP over the years, to carefully survey client maturity on industry benchmarks and estimate the likely benefits enabled by solution capabilities, derives ROI, NPV, IRR and BEP, and generates outputs by business process or by financial terms, like Revenue, COGS and SG&A.
This work by SAP, in the asset-intensive industry sectors, has resulted in industry benchmarks for Return on Assets, Operating Margin, Capex as a % of Revenue, Annual Service and Maintenance Cost as a % of Asset Value, Unplanned Downtime and Outages, and others. The Retail and CPG and related industries are also represented. Through this work, SAP determines likely outcomes depending on company maturity level across many key performance indicators. This results in a segmentation of “leaders” and “laggards” broken into upper, middle and lower quartiles, so companies can understand their present performance versus their peers and determine a course of action to increase their relative and absolute business outcomes. Utopia collaborates with SAP on value assessments and business cases. With a proper diagnosis, the next step is to get the correct prescription leading to a good outcome.
Using Proper Diagnosis to Get the Right Prescription
This work is extremely valuable because, as in the doctor example, it helps clients take ownership of their future by giving them the knowledge of what is happening today, the reasons for present performance, what can be done to mitigate inhibitors, and to help envision a path going forward toward running better. It helps clients understand what it will take to achieve better outcomes.
Beyond this valuable SAP research, 3rd party consulting firms, universities and research companies have conducted their own studies and published similar industry benchmarks and KPIs, based on their own experience and interactions with corporations over the past 30 years. This is a vast pool of information that we at Utopia leverage to help diagnose company performance issues, then prescribe ways to fix problems. Companies can understand the likely benefits in dollar terms, and what it might cost to achieve the outcomes, not just in dollars, effort but also time and risk – so they have the financial substantiation to move forward on improvement investments. Sometimes doing nothing is better than doing the wrong thing; we want to assist in knowing the right thing and doing it right.
Utopia discovered few of these studies were focused purely on the value of being data driven, because the models often do not consider present as-is data quality as an input factor. This is important because no system works well without good data.
We created the Utopia Strategic Value Management (SVM) team and have built our own value engine based on external research, based on SAP value engineering, and based on our own collective hundreds of years of experience working in the “data industry”. We often conduct Data Health Assessments (DHA) to gain insight into present data quality, based on industry-accepted best practices and rules, which can help diagnose problems and facilitate the path forward.
Additionally, by collaborating with SAP Value Engineers globally, as well as with other big five (5) consulting firms (other Utopia partners), across industries, researching available 3rd party studies and papers, Utopia SVM created a model that estimates the value of data, that assists in data strategy and direction, so that they can optimize the expected ROI from investments in people, process, technology and data. Why? Because nothing runs well without good data, or rather, business runs best with best data. The converse is, business runs bad with bad data.
“If you think good data is expensive or difficult to achieve, try to run your business well and sustainably as a leader in your industry with bad data.”
For proof, ask anyone in your business for their top 5 reasons for missing KPI’s. It is very likely they will tell explain they’ve got bad data and it never seems to improve, and it has been that way for years. We have customers who have struggled with bad data in some cases for decades.
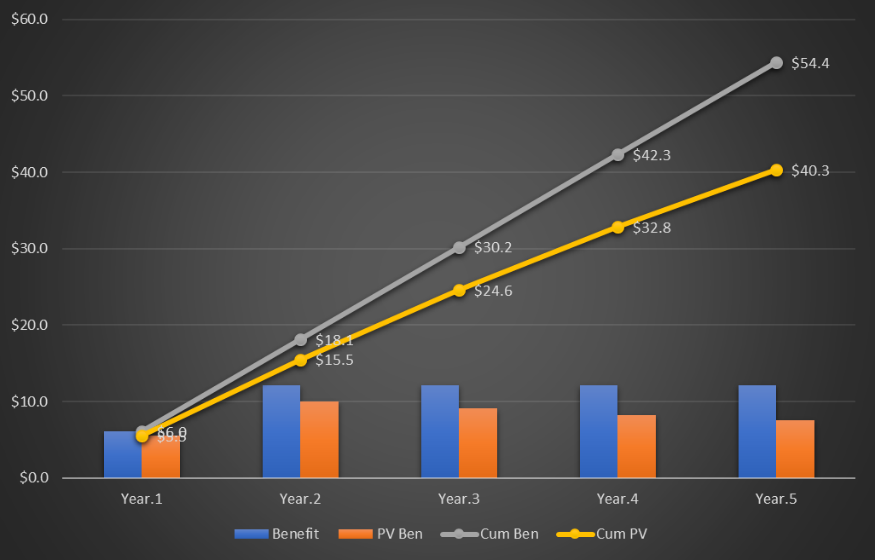
The chart illustration is an anonymous output of our SVM model for an actual customer. To keep it simple we’re not showing the whole model. This one shows the benefits without the costs. Note the annual likely returns (in blue), the discounted returns (orange), and the yellow curve showing the NPV of the benefits over time. We can adjust the Weighted Average Cost of Capital (WACC), we can account for inflation, growth, headcount, and rely on benchmarks for our defaults. Also, we conduct short, but meaningful interviews with customers to get specific inputs when available.
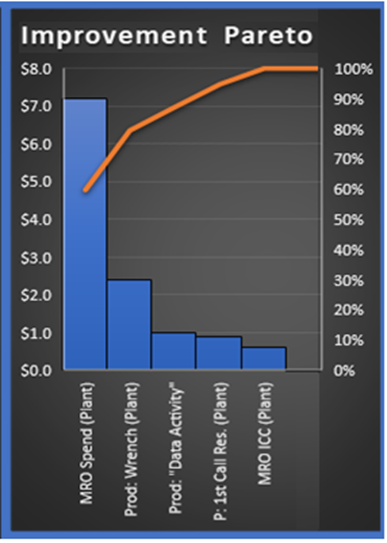
We’ve adjusted and tuned our model on a case-by-case basis for client consensus which helps tremendously in gaining executive sponsorship and momentum behind data programs that drive value. We’ve learned that the C-suite can be very supportive of data quality improvement programs once they understand the impact. The example shown is a relatively small $3B chemical company with the potential benefit value of $40M in today’s dollars, over five years. The first year assumes 50% of the benefit is available. The Pareto diagram shows the source of the benefits in order based on dollar value. We didn’t include EH&S and GRC in the estimated benefit value because those events are “lumpy” and difficult to quantify. We also excluded savings from capital investments in new plants via information handover efficiencies using standards such as CFIHOS and ISO-14224. The potential benefits are “huge”.
High Value Prognosis via Better Data Quality
The goal isn’t to fix data for the sake of having better data quality, it’s to help customers understand how data quality impacts their ability to run their business like the leaders in their peer group, to show them a path to improving their business performance and outcomes, and to enable them to start down that path when they are ready. The concept of the “digital twin” - when your financial assets, functional locations, equipment, BOMs, materials, inventory, engineering, maintenance and supply chain are fully in agreement – enables your company to run efficiently, gain economies of scale, and drive synergies across functional areas and lines of business.
The moral is, correctly diagnose, then correctly prescribe, and then follow-up and assure the prognosis is good (the outcome). Doing this can reduce time to heal, time to value, and accelerate the benefits and outcomes. In a similar way, Utopia can help you identify data problems that impact your business outcomes, help show you the value of those impacts, and work with you to help mitigate and resolve them quickly.
Make your data great and please be safe.
Contact Utopia Strategic Value Management (SVM) at SVM@UtopiaInc.com for more information.


